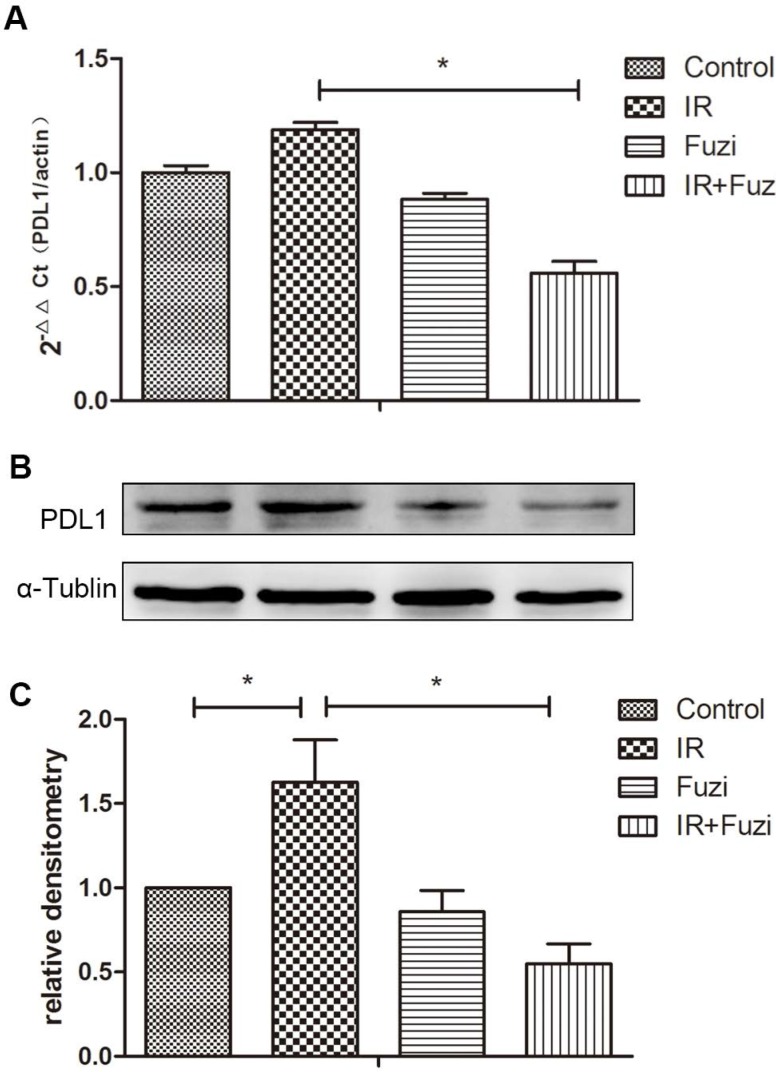
Figure 5.
PD-L1 expression in tumor tissues of four groups. A. RT-PCR analysis of PD-L1 mRNA levels in the transplanted tumor cells. Data represented mean ± SEM (n = 3). *p < 0.05. B. Western blot analysis of PD-L1 protein levels in the transplanted tumor cells. Shown were representative blots. α-tubulin was loading control. C. Densitometry analysis of PD-L1 protein levels in the transplanted tumor cells in four groups. *p < 0.05. Data represented mean ± SD (n = 3).

