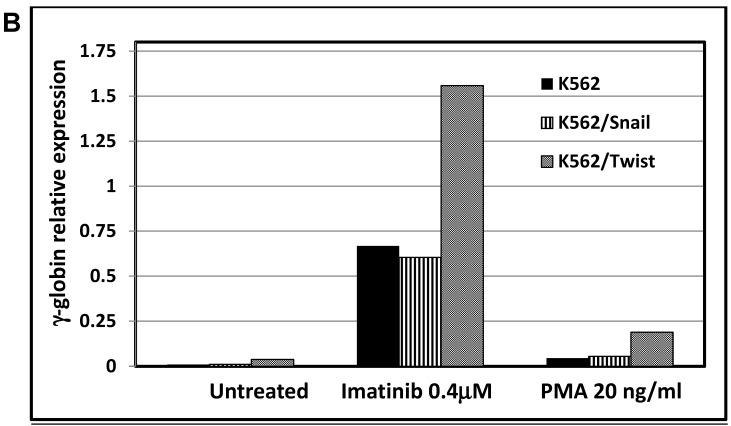
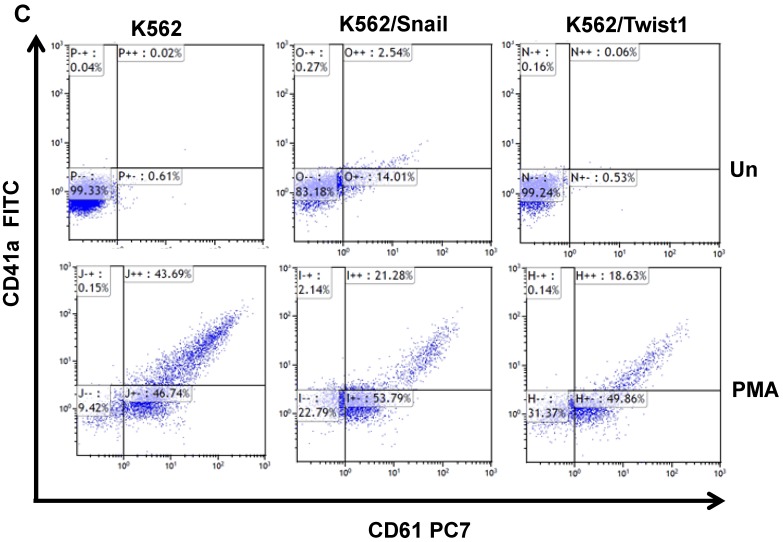
Figure 5.
Effect of Snail and Twist1 on induction of K562 differentiation: (A) Real-time PCR showing relative levels of γ-globin and β-actin in K562 cells treated with imatinib for 6 days. (B) Quantitative presentation of relative γ-globin levels (normalized to β-actin) as a marker for erythrocyte differentiation. (C) Flow cytometry analysis following CD41/CD61 in K562 cells treated with 5 ng/ml PMA for 6 days compared to untreated cells. (D) Quantitative levels of CD41/CD61-positive cells after exposure to PMA (1 ng/ml) for 6 days. Experiments were repeated twice with comparable outcome.


