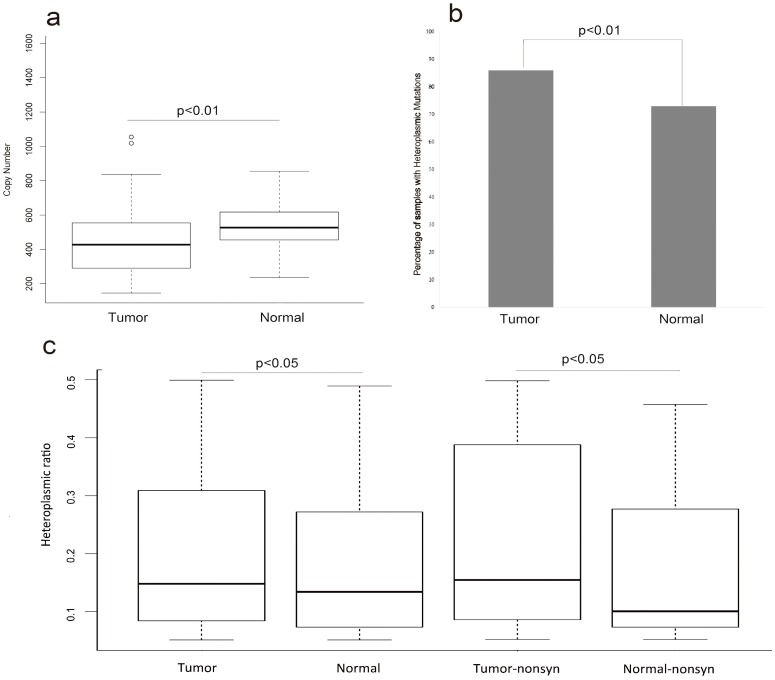
Figure 1.
The copy number and heteroplasmic mutations of tumor and normal samples (a) represented that the difference of copy number variation in tumor and normal samples (T-test, p<0.01). (b) represented the difference of the ratio of samples with heteroplasmic mutations between tumor and normal samples (Chi-squared test, p<0.01). (c)represented that comparing the heteroplasmic ratio of heteroplasmic mutations in tumor and normal samples (T-test, p<0.05) and comparing the heteroplasmic ratio of nonsynonymous mutations in tumor and normal samples (T-test, p<0.05).

