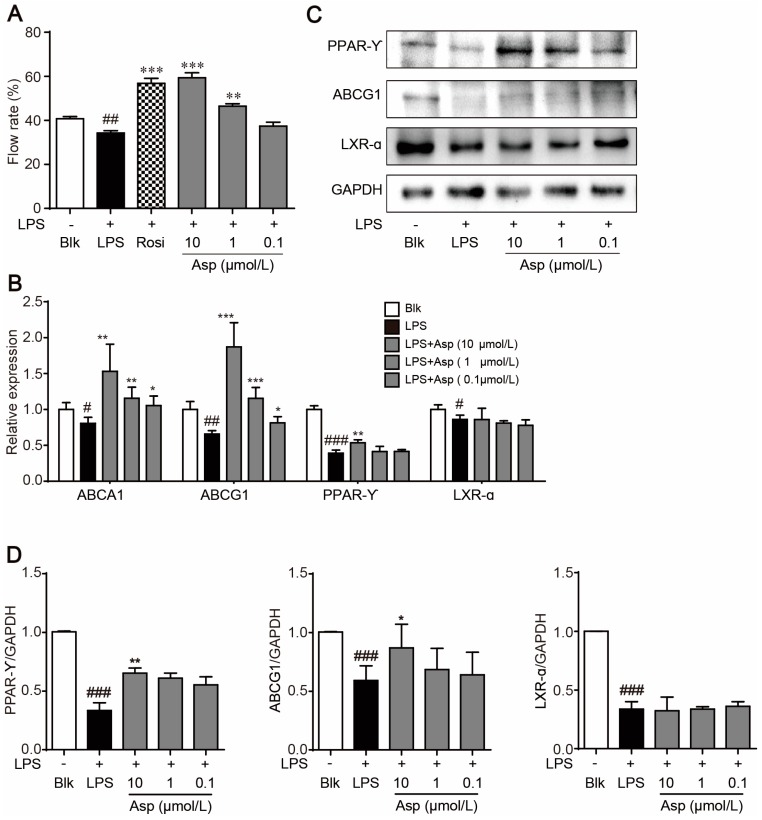
Figure 4.
Asperlin stimulated cholesterol efflux in LPS-treated RAW264.7 macrophages. (A) Cholesterol efflux rate. (B) Realtime PCR of cholesterol efflux-regulating genes. (C) Western blotting of cholesterol efflux-regulating proteins. (D) Quantitative analysis of the western blots grey. Data are shown as means ± SD. # p < 0.05, ## p < 0.01, ### p < 0.001, LPS group vs. Blank group; * p < 0.05, ** p < 0.01, *** p < 0.001, test groups vs. LPS group. Blk: blank; Rosi: rosiglitazone; Asp: asperlin.

