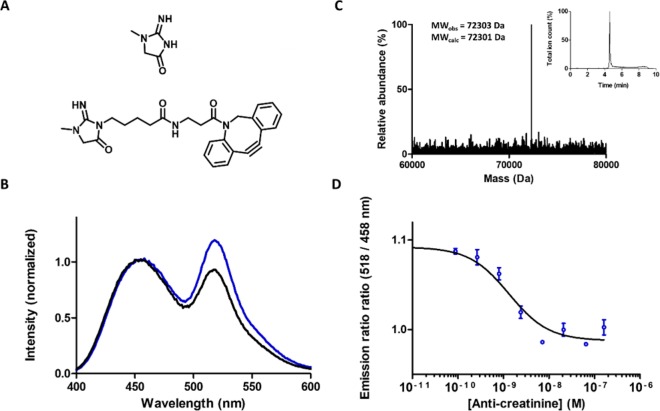
Figure 4.
(A) Molecular structure of creatinine (top) and creatinine-DBCO (bottom) used to functionalize DNP-LUMABS. (B) Deconvoluted mass spectrum and LC elution profile of DNP-LUMABS. The major peak represents the sensor with two DNP moieties attached (expected MW = 72301 Da). (C) Luminescence emission spectra of 5 nM CR-LUMABS in the absence (blue line) and presence (black line) of 20 nM anticreatinine antibodies. (D) Emission ratio of 10 pM CR-LUMABS as a function of antibody concentration. Measurements were performed in a buffer composed of 50 mM Tris, 100 mM NaCl, 10% (v/v) glycerol, and 0.05% Tween-20 at pH = 7.4. Error bars show mean ± s.e.m. (n = 2). Solid line represents fit to eq 2.

