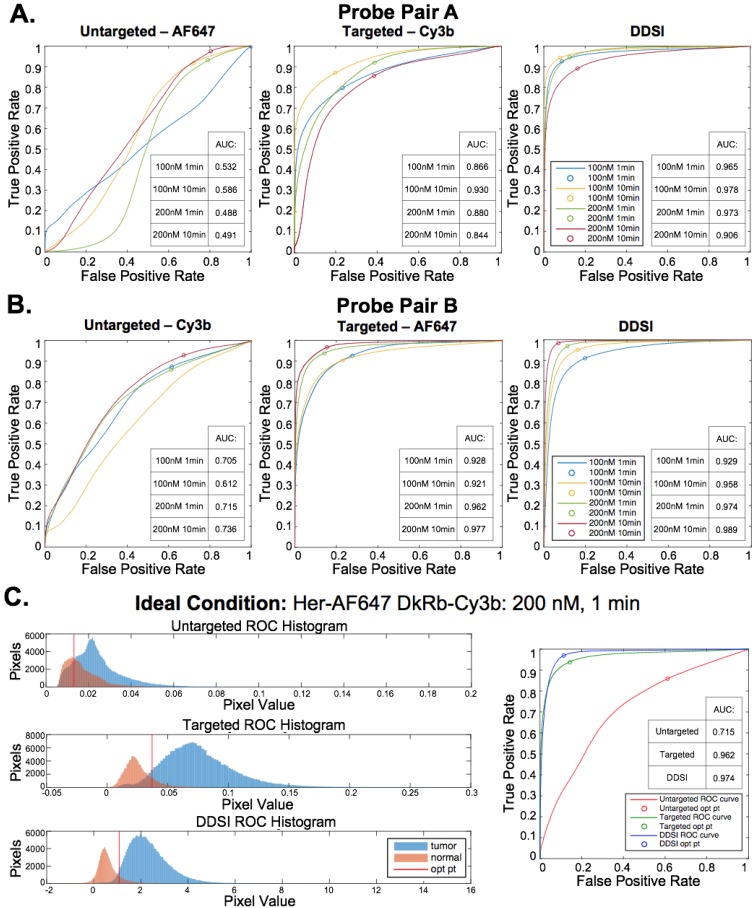
Fig 4.
ROC curve analysis and optimal DDSI staining condition selection. ROC curves and AUC values for untargeted, targeted, and DDSI images of tumor vs. normal adipose tissue differentiation following staining using a range of dual-stain soak concentrations and incubation times for (A) probe pair A (Herceptin-Cy3b, DkRb-AF647) and (B) probe pair B (Herceptin-AF647, DkRb-Cy3b). (C) Tumor and normal tissue pixel intensity histograms, ROC curves, and AUC values for untargeted, targeted, and DDSI images following staining using probe pair B at 200 nM concentration and 1 min incubation time. Optimal points determined from ROC curve analysis are displayed on each ROC curve and as a vertical line on each pixel value histogram. ROC: receiver operator characteristic; AUC: area under curve; opt pt: optimal point.

