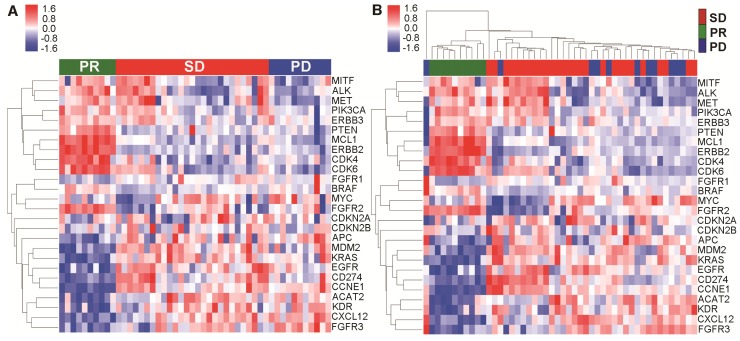
Figure 3.
Copy number variation (CNV) # from cfDNA was associated with the effect of first-line chemotherapy. (A) CNV profiles from cfDNA was significantly different between patients with PR vs. SD/PD; (B) Clear segregation according to objective response was observed via hierarchical clustering of cfDNA. # To reduce the noise signal, the average CNV value of all patients with PR was compared to determine the relative CNV value of each patient.

