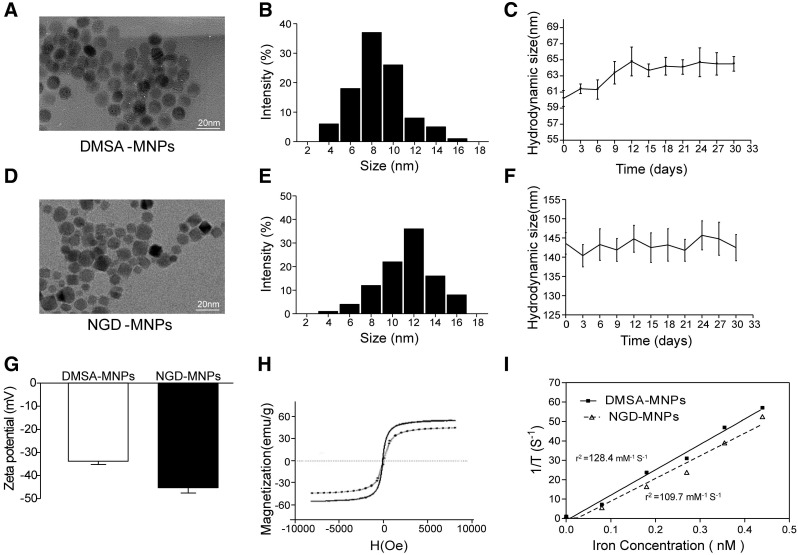
Figure 2.
The characterizations of MNPs. (A, D) TEM micrograph (the scale bar is 20 nm). (B, E) The size distribution of MNPs. (C, F) The hydrodynamic diameters and dispersive stability of MNPs measured by DLS. (G) The zeta potential of MNPs measured by DLS. (H) The magnetization curves of MNPs. (I) The relaxivities (r2) of MNPs.

