Figure 8.
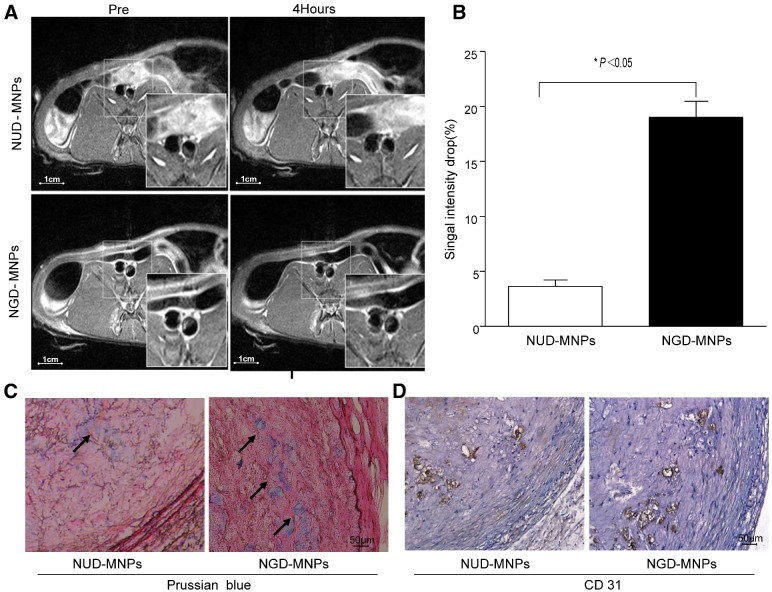
In vivo MR imaging study. (A) The MR images of abdominal aorta before and 4 h after NGD-MNPs or NUD-MNPs injection (the scale bar is 1 cm). (B) Comparison of the relative signal intensity change (NENH%) in the T2-weighted images of abdominal arterial wall before and 4 h after NGD-MNPs or NUD-MNPs injection. (C) Prussian blue staining images show the accumulation of NGD-MNPs or NUD-MNPs in the plaque tissues extracted from rabbits. (D) CD31 immunohistochemistry images were recorded for showing the co-localization of CD31 and NGD-MNPs in the corresponding tissues (the scale bar is 50 μm).

