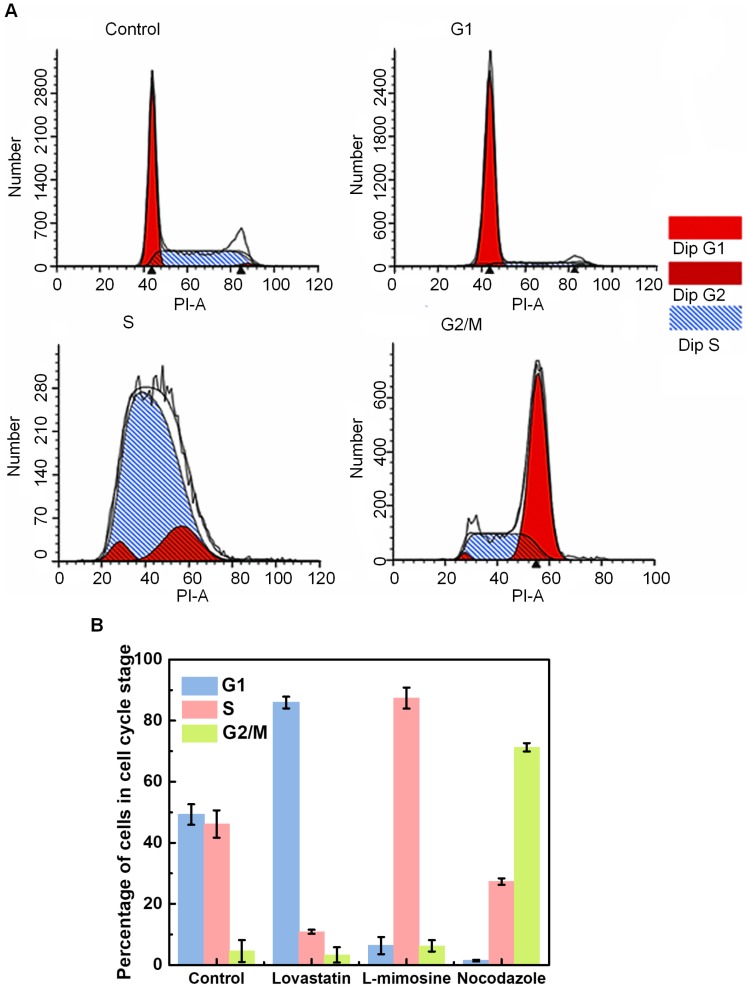
Figure 3.
Cell cycle synchronization analysis done by flow cytometry. (A) Flow cytometry histograms indicating the distribution of the DNA content in HeLa cells in the control group (viz., unsynchronized group), and cells synchronized at the G1, S and G2/M phases following the treatment of lovastatin, L-mimosine and nocodazole, respectively. The y-axis represents the number of cells, and the “PI-A” in the x-axis represents the fluorescence intensity of PI that is used to assess the amount of cellular DNA content; and (B) Percentage of cells in individual cycle phases in the control group, and cells synchronized at the G1, S and G2/M phases after lovastatin, L-mimosine and nocodazole treatment, respectively.

