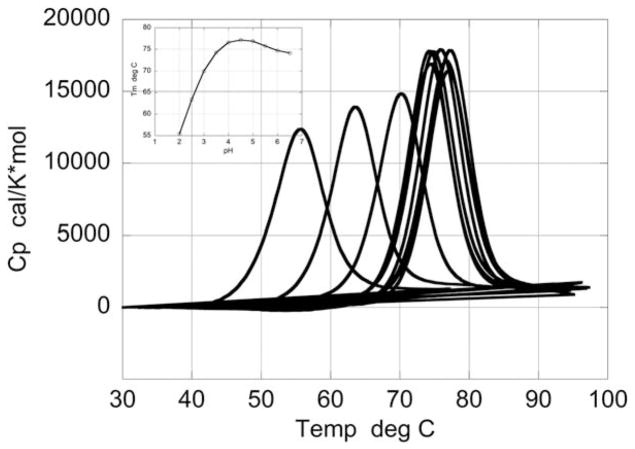
FIGURE 1.
Temperature dependence of the excess heat capacity function of HEWL at different pH values in the range pH 2.0–6.5, where the denaturation transition is reversible. The protein concentration was ~ 1 mg/mL in all scans. The midpoint of the transition (Tm) increases with increasing pH and reaches a maximum at pH 4.5 after which a slight decrease is observed as shown in the plot of Tm as a function of pH (inset)

