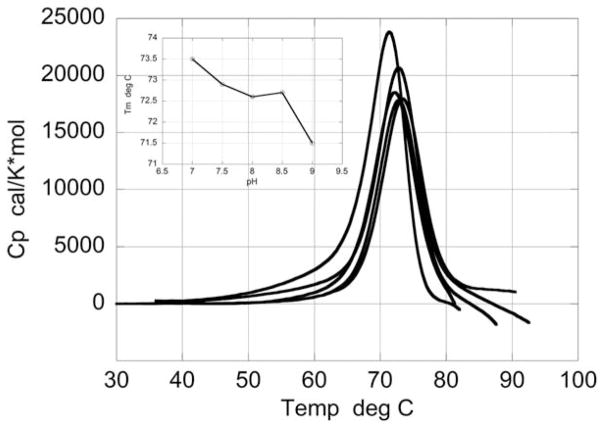
FIGURE 2.
Temperature dependence of the excess heat capacity function of HEWL at different pH values above pH 7.0, where irreversible denaturation is observed. The protein concentration was the same as for the reversible scans shown in Figure 1. The transition is followed by exothermic aggregation, which usually is observed as a drop in heat capacity at the end of the scans. The inset shows Tm as a function of pH

