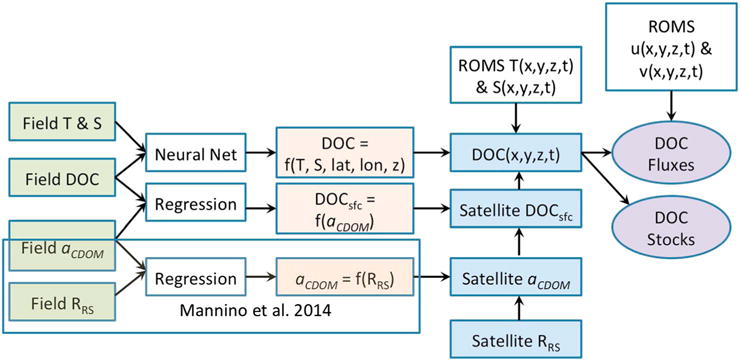
Figure 1.

Flow diagram illustrating the process for computing DOC stocks and fluxes. T = temperature, S = salinity, DOC = dissolved organic carbon, DOCsfc = surface DOC, aCDOM = CDOM absorption coefficient, RRS = remote sensing reflectance, the T(x, y, z, t) and S(x, y, z, t) notations refer to the four-dimensional temperature and salinity fields from the ROMS model, and u(x, y, z, t) and v(x, y, z, t) represent the model velocity components. The shaded portion in the lower left shows the development of the aCDOM satellite algorithms from Mannino et al. [2014].
