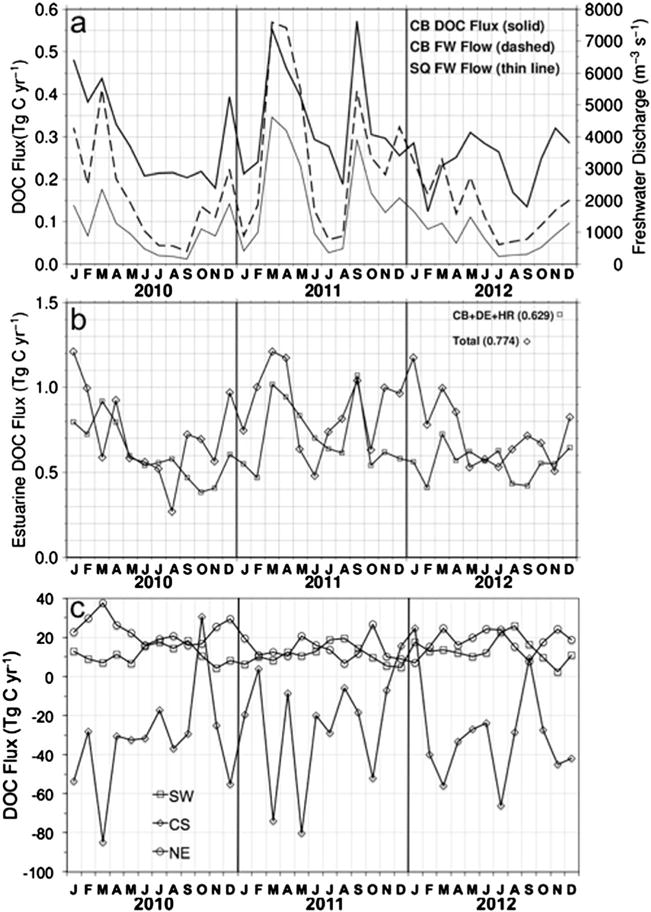
Figure 12.

Time series of (a) DOC flux and freshwater (FW) discharge at the mouth of Chesapeake Bay (CB) and from the Susquehanna River (SQ) at Conowingo Dam (USGS); (b) estuarine DOC flux total for the MAB and summed CB, Delaware Estuary (DE), and Hudson-Raritan Estuary (HR); and (c) MAB boundary DOC fluxes along the SW, NE, and cross shelf along the 100 m isobath.
