
Fig. 1.
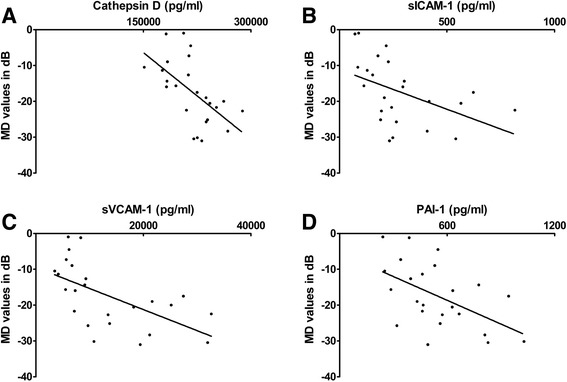
Relationships of MD (dB) to cytokine concentrations. The scatter grams showing the correlations between the MD in Humphrey Visual Field Analyzer and the levels of cathepsin D (a), sICAM-1 (b), sVCAM-1 (c) and PAI-1 (d) in AH of eyes with POAG. The x-axes represent the levels of cytokines, and the y-axes represent the MD values (dB).