
Fig. 2.
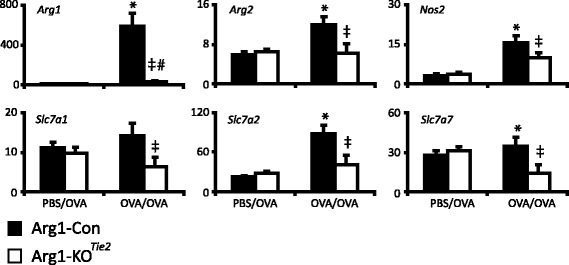
Effect of Arg1 ablation in the lung on the expression of arginine-metabolizing enzymes and arginine transporters. Black bars represent Arg1-Con mice and white bars Arg1-KOTie2 mice. The specific treatment (PBS/OVA or OVA/OVA) is indicated below the columns. mRNA abundance (AU = number of mRNA copies normalized to 18S rRNA expression and multiplied by 104) of the arginine-metabolizing enzymes Arg1, Arg2, and Nos2 and the arginine transporters Slc7a1, Slc7a2 and Slc7a7 is shown as mean ± SEM of 7-8 mice per group. Significance symbols: *: P < 0.05 OVA/OVA vs. PBS/OVA Arg1-Con; #: P < 0.05 OVA/OVA vs. PBS/OVA Arg1-KOTie2; ‡: P < 0.05 OVA/OVA Arg1-Con vs. Arg1-KOTie2