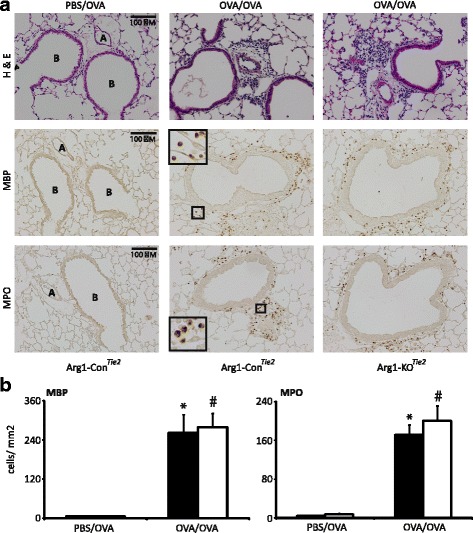
Fig. 6.

Effect of Arg1 ablation in the lung on the prevalence of inflammatory cells in the lungs. A: The left two columns show lungs of PBS/OVA- and OVA/OVA-treated Arg1-Con mice, while the right column shows lungs of OVA/OVA-treated Arg1-KOTie2 mice. Top row: hematoxylin and eosin; middle row: MBP staining for eosinophils; bottom row: MPO staining for neutrophils. Bar: 100 μm. B: Quantification of the inflammatory cells in OVA/OVA-treated Arg1-Con (black bars) and Arg1-KOTie2 (white bars) mice. All sections were stained simultaneously. Means and SEM of 7-8 mice per group are shown. *: P < 0.05 (OVA/OVA vs. PBS/OVA Arg1-Con); #: P < 0.05 (OVA/OVA vs. PBS/OVA Arg1-KOTie2)
