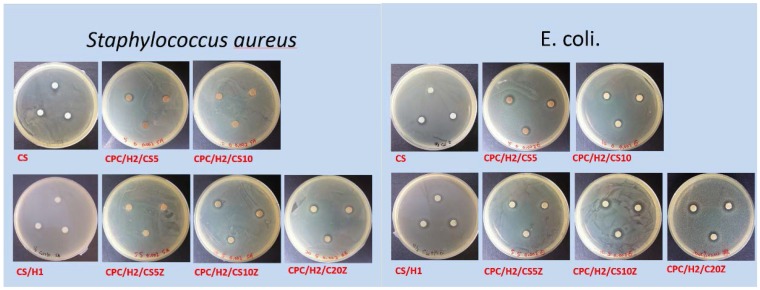
Figure 5.
Summarized of the diameter of inhibition zones (in mm) of CS, CS/H1 and CPC/H2 with different CS compositions on S. aureus and E. coli. The data in the same statistical level was marked with the same letter (a, b, c, and d) after the data.
| Sample Code | CPC % |
Hinokitiol % in Powder |
CS % |
ZnO % in CS |
Diameter of Inhibition Zone | |
|---|---|---|---|---|---|---|
| S. aureus (G+) | E. coli. (G−) | |||||
| CS | 0 | 0 | 100 | 0 | 4 ± 0.45 a | 4 ± 0.5 a,c,d |
| CS/H1 | 0 | 0.125 | 100 | 0 | 6 ± 0.33 b | 7 ± 0.3 b–d |
| CPC/H2/CS5 | 95 | 0.25 | 5 | 0 | 3.11 ± 0.69 a | 3.64 ± 0.25 a,d |
| CPC/H2/CS5Z | 95 | 0.25 | 5 | 5 | 0.50 ± 0.29 c | 3.87 ± 0.25 a,c,d |
| CPC/H2/CS10 | 90 | 0.25 | 10 | 0 | 0.75 ± 0.25 c | 2.45 ± 0.25 a |
| CPC/H2/CS10Z | 90 | 0.25 | 10 | 5 | 4.02 ± 0.99 a | 6.08 ± 1.44 b–d |
| CPC/H2/CS20Z | 80 | 0.25 | 20 | 5 | 5.03 ± 0.27 a,b | 5.29 ± 0.25 d |

