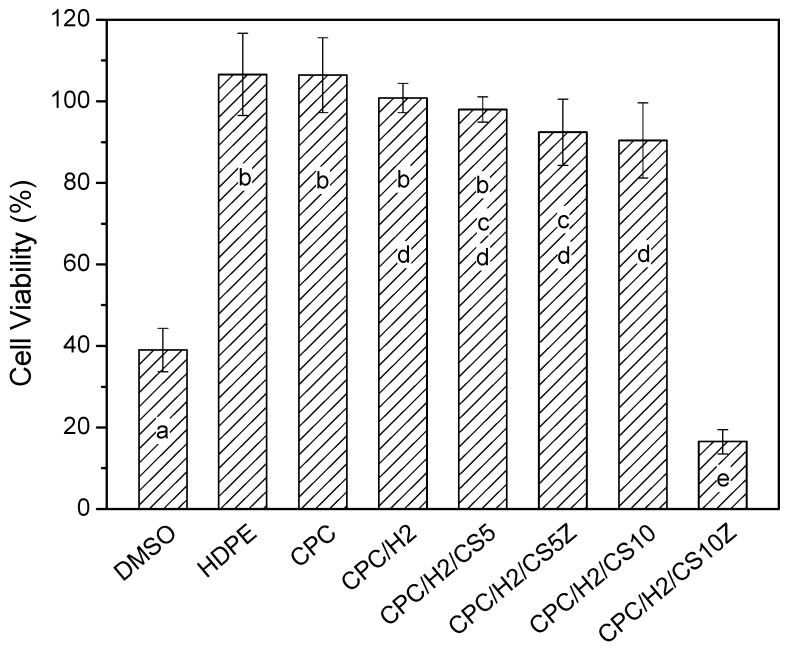
Figure 8.
The relative cell viabilities (%) of CPC, CPC/H2, CPC/H2/CS5, CPC/H2/CS5Z, CPC/H2/CS10 and CPC/H2/CS10Z compare with HDPE (positive control group), DMSO (negative control group), and a blank group (as 100% cell viability) obtained in 24 h cultures. The data in the same statistical level was marked with the same letter (a, b, c, d, and e) on the bar.

