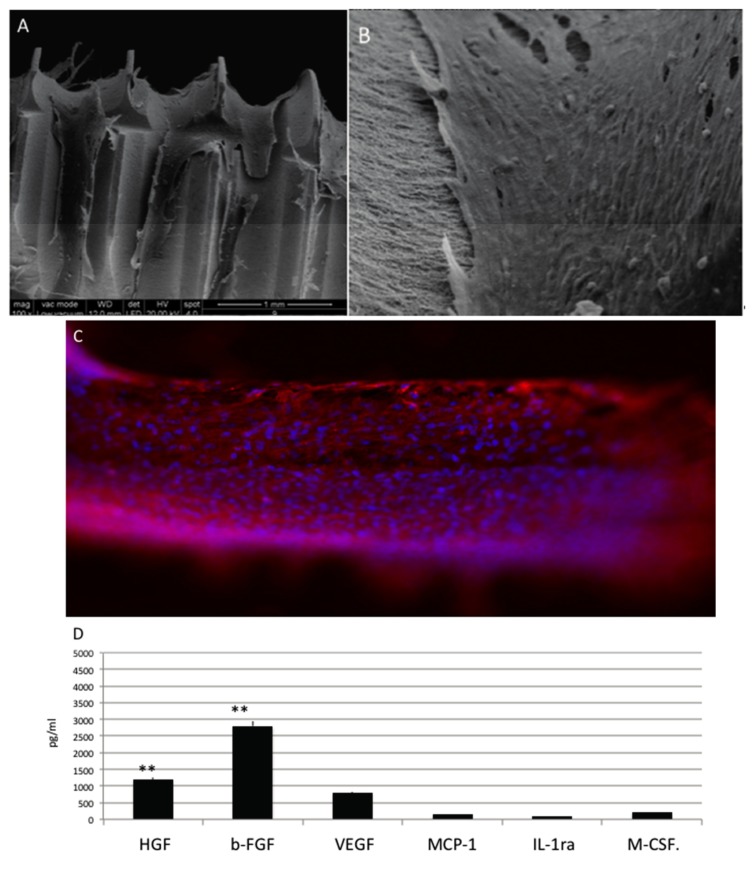
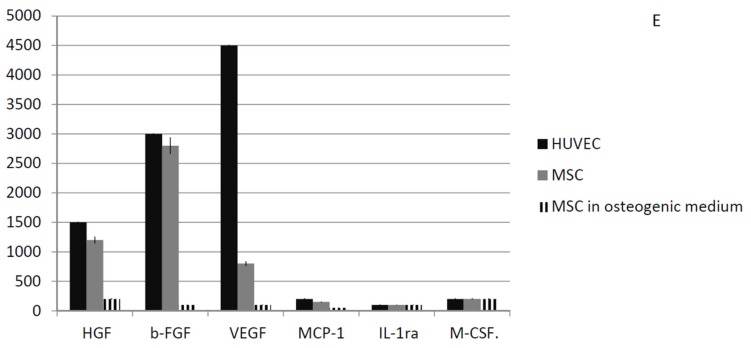
Figure 4.
(A,B) SEM analyses of MSC in presence of no differentiative medium cultured onto OGI surfaces; (C) immunohistochemical test against phalloidine (red) (D) Quantification of growth factor release pg/mL. Statistically significant differences are indicated as ** p < 0.01; (E) Summarized graph about the quantification of growth factor release from the MSCs, osteoblastic like cells, and HUVEC cells.


