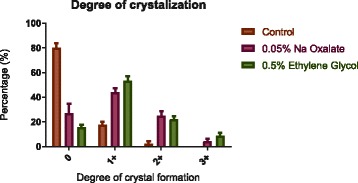
Fig. 4.

Incidence of crystal formation according to degree of crystallization. The degree of crystallization was given a visual scale of 0, 1+, 2+ and 3+ by a single observer. The incidence of crystal formation of the control group was 80%(0), 17.8% (1+) and 2.2% (2+) respectively. The incidence of crystal formation in flies fed on NaOx diet was 27% (0), 43.8% (1+), 25% (2+) and 4.2% (3+). In the EG cohort, the incidence was 15.6% (0), 53.3% (1+), 22.2% (2+), 8.9% (3+) respectively
