
Fig. 6.
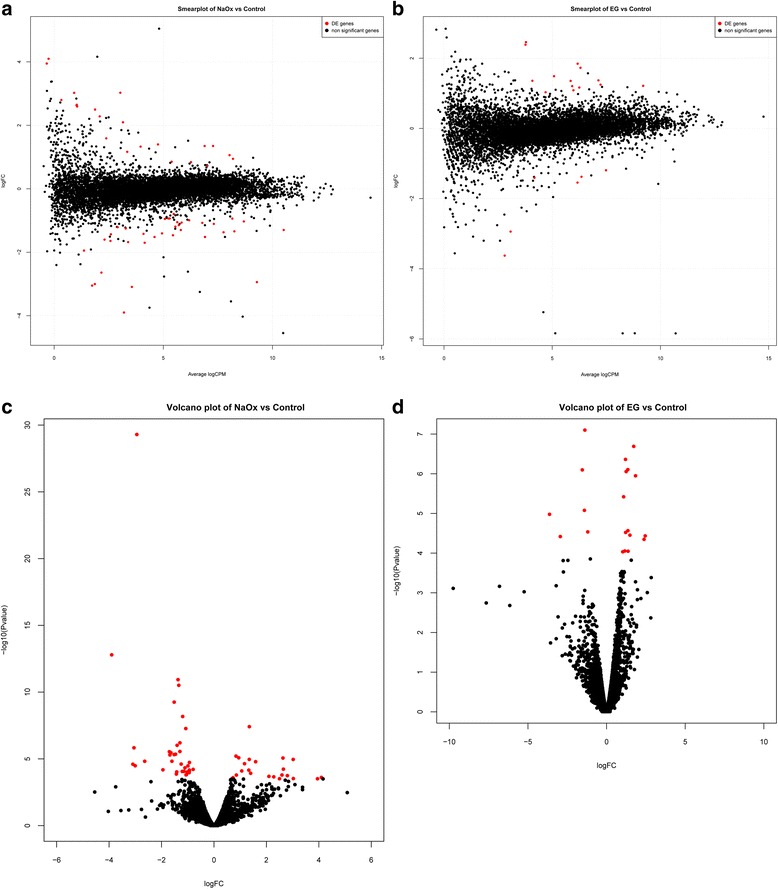
Smear plots and volcano plots of differentially expressed genes in NaOx and EG groups. Differentially expressed genes (FDR <0.05, p < 0.05) compared with control were labelled as red points whereas insignificant genes were labelled as black. The mean expression level, Log Fold Change and p-Value of differentially expressed genes were displayed as smear plots and volcano plots. a Smear plot of NaOx group compared with control. b Smear plot of EG group compared with control. c Volcano plot of NaOx group compared with control. d Volcano plot of EG group compared with control