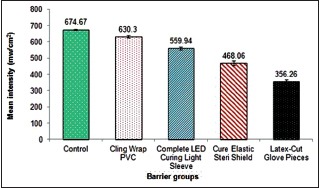
Graph 1.

Mean intensity (mw/cm2) for control and different types of barriers. Dissimilar color shows statistically significant difference among different groups (P < 0.0001; one-way analysis of variance)

Mean intensity (mw/cm2) for control and different types of barriers. Dissimilar color shows statistically significant difference among different groups (P < 0.0001; one-way analysis of variance)