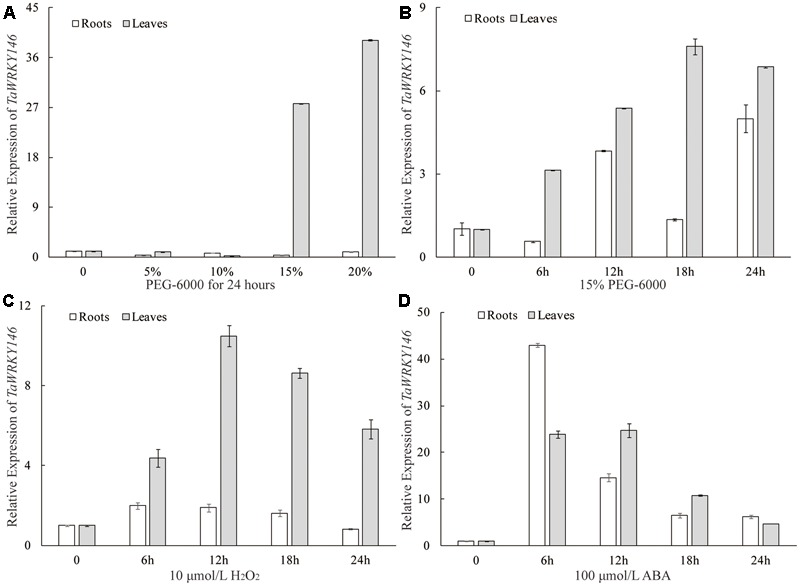
FIGURE 3.

Expression patterns of TaWRKY146 were examined in wheat seedlings under osmotic (A,B), H2O2 (C) and ABA (D) treatments. Values are means ± SEs (n = 3).

Expression patterns of TaWRKY146 were examined in wheat seedlings under osmotic (A,B), H2O2 (C) and ABA (D) treatments. Values are means ± SEs (n = 3).