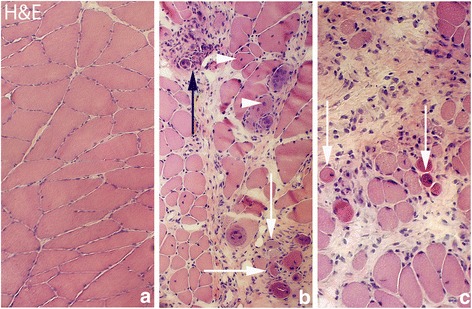
Fig. 1.

Figure demonstrating hematoxylin & eosin staining (H&E) of muscle tissue. a is from the group of the non-experimental animals (control group), representing normal muscle tissue with tightly packed muscle fibers. b and c show muscle tissue from experimental animal (6 week group, contralateral side) (lower magnification in [b] than in [a] and [c]). In (b) and (c) there is an abundance of connective tissue with infiltrating white blood cells and abnormally looking muscle fibers that were not seen in the non-experimental group (a myositis situation). Note the marked variability in muscle fiber sizes in (b) and (c). Black arrow at the place of a necrotic muscle fiber for which the contour is lost and white arrows at muscle fibers that are small and that to varying extents show a basophilic appearance. Fibers with internal nuclei are seen (b) (white arrowheads). Orig. magnif. ×300 (a, c), ×200 (b)
