Fig. 14.

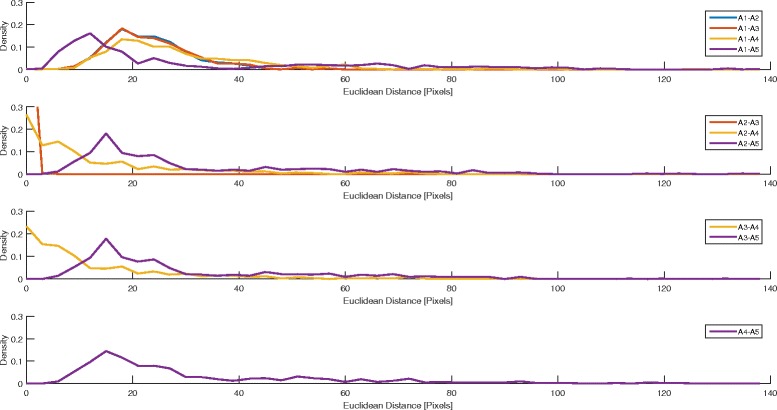
Histogram of Euclidean distances between the probability values generated by any two statistical algorithms (probability density versus Euclidean distance). Alg2 and Alg3 (red line in the second row) exhibit the most similar results

Histogram of Euclidean distances between the probability values generated by any two statistical algorithms (probability density versus Euclidean distance). Alg2 and Alg3 (red line in the second row) exhibit the most similar results