Fig. 5.

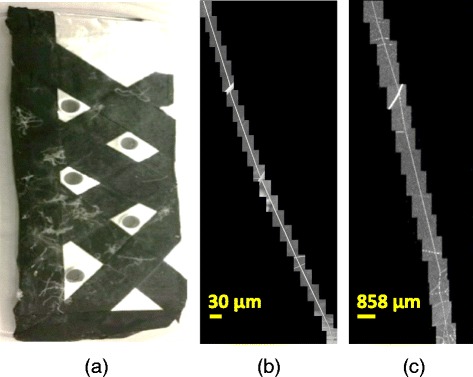
Single fiber data. (a) Single fibers mounted on a sample, (b) 2D SEM images stitched along one fiber, and (c) 2D max projections of 3D CLSM z-stacks that are roughly stitched along one fiber

Single fiber data. (a) Single fibers mounted on a sample, (b) 2D SEM images stitched along one fiber, and (c) 2D max projections of 3D CLSM z-stacks that are roughly stitched along one fiber