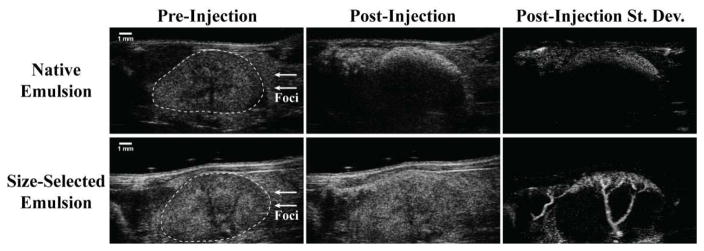
Fig. 5.
Visualization of DFB droplet vaporization within the mouse kidney at 30-MHz nominal center frequency with a standard B-mode imaging sequence. Here, two droplet emulsions prepared by microbubble condensation are compared. Each produces a DLS measurement with a peak in the 200–300-nm range, but the “size-selected emulsion” has been processed to remove large outliers not represented by DLS [43]. When exposed to 100% power 5 min after injection, bubble formation was observed in the proximal kidney cortex. Native emulsions resulted in a high degree of stationary contrast in the cortex with significant shadowing deep in the kidney—indicative of occlusion by large bubbles produced from outlier droplets, whereas size-selected emulsions produced primarily free-flowing bubbles of lower echogenicity that appeared as speckle variance from frame to frame. Passing the B-mode cine loops through a standard deviation filter, removing frames containing breathing motion, and summing the remaining frames illustrates the significant qualitative differences between the two emulsions, with size-selected droplets producing significantly greater speckle variance along the kidney cortex and through the associated interlobar veins. Note: hand-drawn ROI added to preinjection B-mode images in order to delineate kidney boundaries from surrounding tissue. Reproduced from [43] with permission from Elsevier.

