Figure 3.
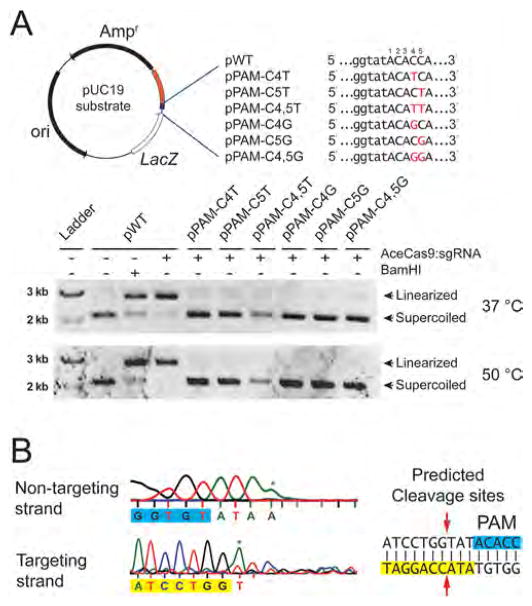
Experimental confirmation of the 5′-NNNCC-3′ PAM for AceCas9 on plasmid DNA substrates. (A) (Top left) Schematic representation of the pUC19 plasmid substrate for AceCas9 with protospacer and the PAM regions colored orange and blue, respectively. Names of the plasmids corresponding to the sequence variations (red) in the PAM region are shown to the right. (Top right) Sequences and names of a series of PAM mutations. Sequence alterations are colored red. (Bottom) Cleavage results by Ace-Cas9:sgRNA at 37 and 50 °C for the wild-type and various mutant plasmids visualized by 0.5% agarose gel. (B) The predicted site of cleavage (red arrows) by AceCas9 by sequencing the cleavage product on both strands of the wild-type plasmid. The sequences for the protospacer (yellow) and for the PAM (blue) are typed below the sequence traces. Asterisk denotes extra adenosine resulted from DNA sequencing. Related to Figure S1.

