Figure 5.
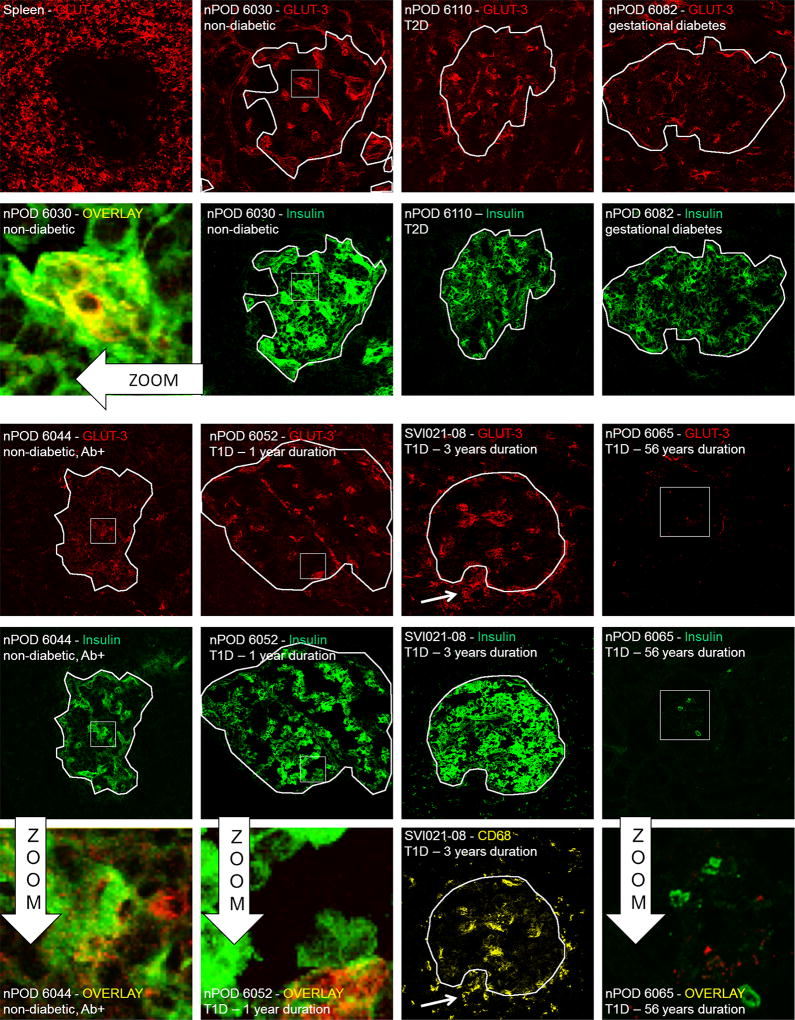
Immunofluorescent glucose transporter 3 (GLUT3) expression survey on pancreatic islets from donors with various diabetic conditions. All representative samples are individually labelled with sample and staining ID. Spleen section from a normal individual served as a positive control for staining, while nPOD6065 in which no GLUT3 mRNA was detected is a negative control. In contrast to GLUT1, a more diffuse staining pattern was obtained for GLUT3, clearly showing less expression as compared to the former. The zoom shows limited areas with yellow colocalization between insulin and GLUT3, indicating that only some beta cells express this transporter. In a type 1 diabetic subject with macrophage + insulitis, these infiltrating cells can be observed as GLUT3+, in line with published data [17]. White outlines demarcate insulin-positive areas and were superposed onto the GLUT3 images for comparison. White squares are zoom regions

