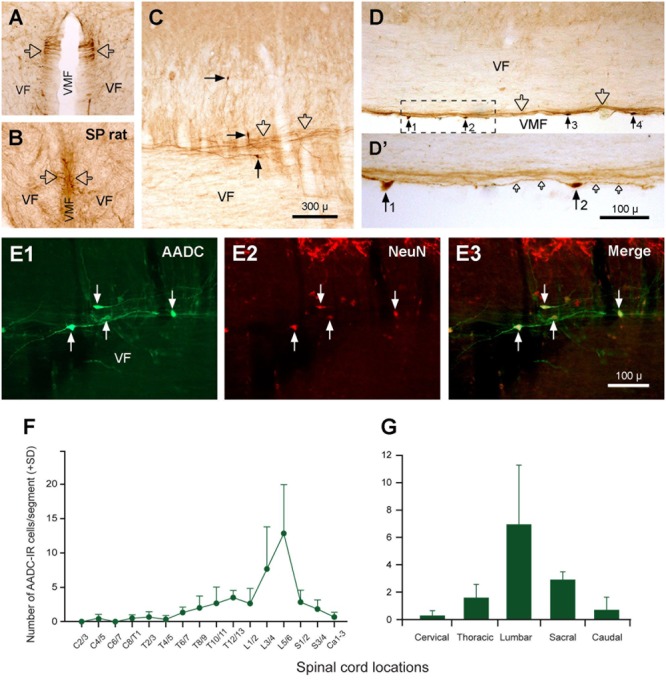
FIGURE 11.

Aromatic L-amino acid decarboxylase cells (neurons) and fibers in the VF along the VMF. (A) A transverse section at the first sacral level from a normal rat showing the AADC fibers in the VF close to VMF (hollow arrows). (B) A transverse section at the fourth sacral level from a 70-day S2 spinalized (SP) rat showing that the AADC fibers in this location persisted after spinal cord transection (hollow arrows). (C,D) AADC neurons (black arrows) and fibers (hollow arrows) in the VF close to the VMF in a parasagittal (C) and a horizontal (D) section. (D’) The enlargement of the area delimited by the dashed line in (D). Four AADC cells (No. 1–4) were seen in (D) and it seems that all of the cells gave rise to fibers from their two ends and projected along the VMF (small hollow arrows in D’). (E1–E3) AADC cells in the VF were NeuN-IR, demonstrating their neuronal property. (F,G) Histograms showing the relative abundance of the AADC neurons in VF in relation to the spinal segments (F) and regions (G) (same format as Figure 10). It can be seen that the lumbar region, especially L5/6 segments, contained the highest density of the cells, the cervical region contained the lowest density of the cells, and the other regions were in between. AADC antibody was from rabbit. Scale bars in (C), valid for (A–D), 300 μm; in (D’), 100 μm; in (E3), valid for (E1–E3), 100 μm.
