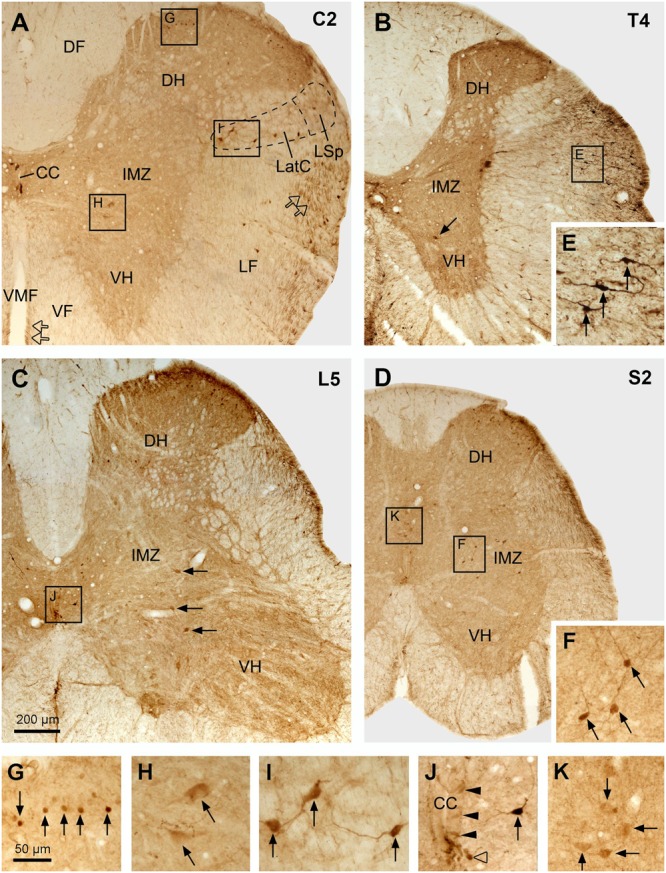
FIGURE 6.

Aromatic L-amino acid decarboxylase cell distribution in different parts of the spinal cord illustrated in transverse sections. (A–D) Photomicrographs of low magnification from selected sections from cervical (C) (A), thoracic (T) (B), lumbar (L) (C), and sacral (S) (D) segments. The spinal segment of the section is indicated in the upper right corner in each panel. Arrows in (B,C) indicate the larger neurons in the IMZ/VH in the T and L segment, respectively. Hollow arrows in (A) indicate AADC fibers in the lateral funiculus (LF) and ventral funiculus (VF) close to the ventral median fissure (VMF). CC, central canal; DF, dorsal funiculus; DH, dorsal horn; LatC, lateral cervical nucleus; LSp, lateral spinal nucleus. (E–K) Enlargements of the areas in (A–D) demarcated with the squares/rectangles showing the details of the AADC-labeled neurons (arrows or arrowheads) in the white matter (E), superficial DH (G), IMZ (larger cells in H and smaller cells in F), LatC (I), around the CC (J, arrowheads indicate the AADC cells around the CC, arrow indicates a AADC cell slightly further away from the CC), and the deep DH (K, here the cells were from the sacral dorsal commissural nucleus). AADC antibody was from rabbit. Scale bar in (C), valid for (A–D), 200 μm; in (G), valid for (E–K), 50 μm.
