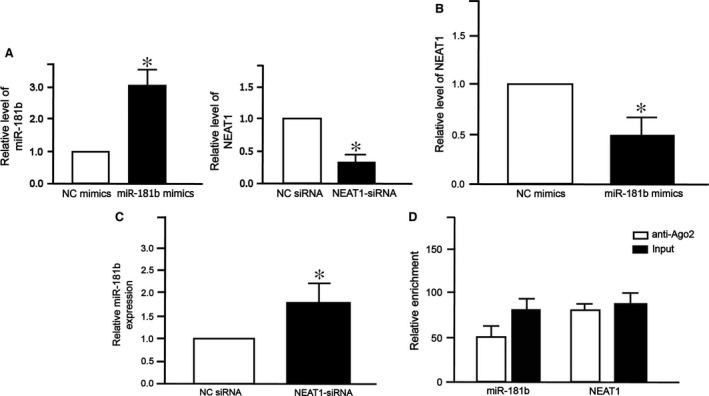
Figure 6.

NEAT1 and miR‐181b levels in HL7702 cells. (A) Relative miR‐181b and NEAT1 levels in HL7702 cells transfected with negative control (NC) mimics versus miR‐181b mimics, or negative control (NC) siRNA versus NEAT1 siRNA. (B) The expression of NEAT1 in HL7702 cells transfected with miR‐181b mimics. (C) The expression of miR‐181b in HL7702 cells transfected with NEAT1‐siRNA. For comparison, expression level in cells transfected with NC mimics or NC siRNA was set to 1. All experiments were repeated three times. Each bar represents the mean ± S.D. of three independent experiments. *P < 0.05. (D) RIP assay showing the relative enrichment of AGO2‐immunoprecipitated NEAT1 and mir‐181b. anti‐Ago2: samples incubated with Ago antibody; Input: cell lysate.
