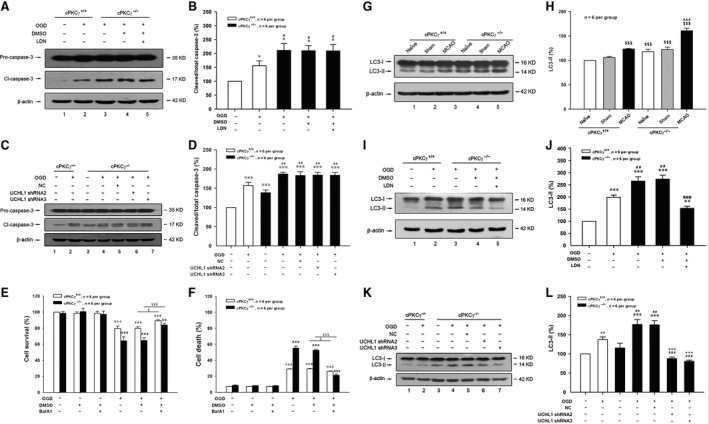
Figure 6.

Effects of UCHL1 on the expression of caspase‐3 or LC3 in cortical neurons after 1‐hr MCAO/24‐hr R or 1‐hr OGD/24‐hr R. Representative results (A and C) and quantitative analysis (B and D) of Western blot showed the effects of LDN (10.0 μM) and UCHL1 shRNA treatments on the expressions of Pro‐caspase‐3 and Cl‐caspase‐3 from Normoxia and OGD groups of cPKCγ+/+ and cPKCγ−/− cortical neurons (n = 6 per group), respectively. Quantitative results showed the effects of autophagy inhibitor BafA1 (100.0 nM) on the rate of cell survival (E) and the rate of cell death (F) from Normoxia and OGD groups of cPKCγ+/+ and cPKCγ−/− cortical neurons (n = 6 per group), respectively. Representative result (G) and quantitative analysis (H) of Western blot showed the expression of LC3‐I and LC3‐II in the cortex from Naïve, Sham and MCAO groups of cPKCγ+/+ and cPKCγ−/− mice (n = 6 per group), respectively. Representative results (I and K) and quantitative analysis (J and L) of Western blot showed the effects of LDN (10.0 μM) and UCHL1 shRNA treatments on the expressions of LC3‐II and LC3‐I from Normoxia and OGD groups of cPKCγ+/+ and cPKCγ−/− cortical neurons (n = 6 per group), respectively. ***P < 0.001, **P < 0.01, *P < 0.05 versus Normoxia of cPKCγ+/+ neurons; ### P < 0.001, ## P < 0.01, # P < 0.05 versus corresponding cPKCγ+/+ cortical neurons with the same treatment; £ P < 0.05 versus OGD of cPKCγ+/+ neurons without BafA1 treatment; ¥¥¥ P < 0.001 versus OGD of cPKCγ−/− neurons without BafA1 treatment; $$$ P < 0.001 versus NaÏve of cPKCγ+/+ mice; &&& P < 0.001 versus corresponding cPKCγ+/+ mice with the same treatment; @@@ P < 0.001 versus vehicle of LDN group with the same treatment; +++ P < 0.001 versus NC with the same treatment.
