Figure 2.

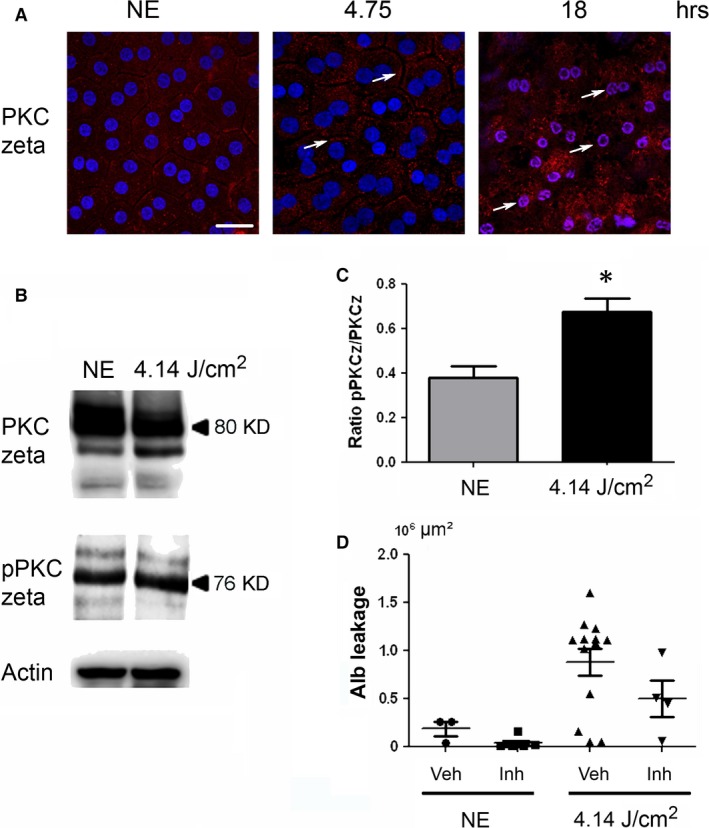
The activation of PKC zeta after LED exposure. Male Wistar rats aged 7 weeks (n = 4) were exposed to white LED for 4.75 hrs and 18 hrs. NE: Non‐exposed rats. (A) At the end of the exposure period, the RPE was flat‐mounted and immunostained with anti‐PKC zeta and DAPI then examined by confocal microscopy. The white arrows point PKC zeta located at the plasma membrane (4.75 hrs) and at nuclear localization (18 hrs). The pictures were taken on the upper retina 100 μm away from the optic nerve. Scale bar represents 20 μm. (B) After 4.75 hrs (4.14 J/cm2) of light exposure, the eyes were enucleated, and the RPE dissected, extracted with M‐PER buffer and loaded on the top of a 10% SDS–PAGE, transferred onto a nitrocellulose membrane and probed for anti‐PKC zeta (upper panel), anti‐phospho‐PKC zeta (middle panel) and anti‐actin antibody as a charge control (lower panel). (C) The histogram shows a quantification of PKC zeta phosphorylation expressed as a ratio to PKC zeta normalized to actin. Values are significantly different *=P < 0.05. (D) The inhibition of PKC zeta induced a decrease in the leakage of albumin as shown by the decrease in the number of leakages (each point) and the decrease of their size. This is the result of a representative experiment; Vhe: vehicle, Inh: PKC zeta inhibitor.
