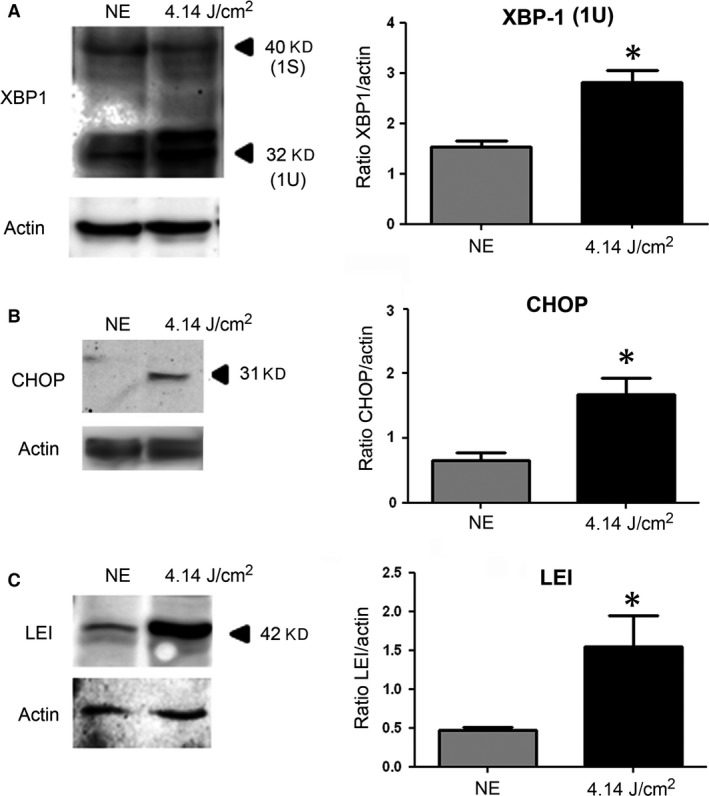
Figure 4.

Western blot analysis of mechanisms of stress response after LED exposure. Male Wistar rats aged 7 weeks (n = 4) were exposed to white LEDs for 4.75 hrs. NE: Non‐exposed animals. At the end of the exposure period, the eyes were analysed regarding different effectors of stress response. After light exposure, the eyes were enucleated, the RPE dissected, extracted with M‐PER buffer and loaded on the top of a 12% SDS–PAGE, transferred onto a nitrocellulose membrane and probed for different antibodies. (A) WB using anti‐XBP1 antibody. The histogram to the right shows a quantification of XBP‐1U protein expressed as a ratio to actin. Values are significantly different P < 0.05. (B) Same experiment that in panel A using anti‐CHOP antibody. The histogram to the right shows a quantification of CHOP protein expressed as a ration to actin *=(P < 0.05). (C) Same experiment using anti‐LEI‐derived DNase II (LEI/L‐DNase II) with its quantification by histogram (P < 0.05). Actin was used as a charge control in the different experiments.
