
Figure 7.
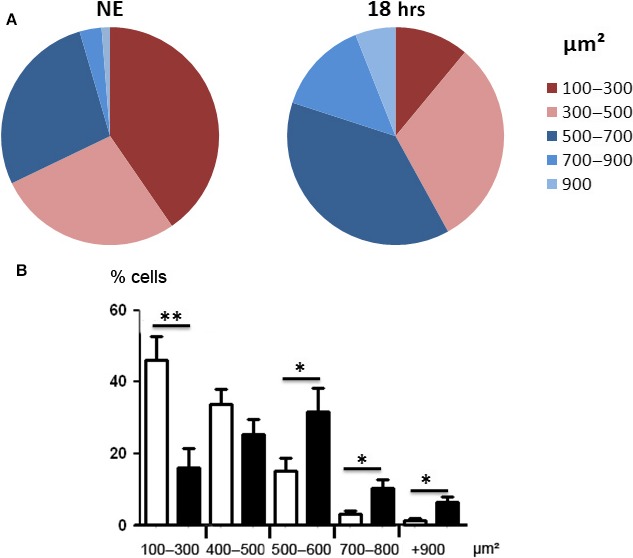
Distribution of cell sizes of the RPE after LED exposure. Male Wistar rats aged 7 weeks (n = 4) were exposed to white LED for 18 hrs. NE: Non‐exposed rats. At the end of the exposure period, the RPE was flat‐mounted and stained with phalloidin, which binds to polymerized actin. An analysis of the number of cells depending on their cell surface was done by confocal microscopy using the Fiji software, eight eyes were analysed, and at least 100 cells/eye were evaluated. Sector diagram (A) shows the distribution of cells according to their size. The statistical analysis is shown in the lower histogram (B). (*P < 0.05; **P < 0.01). White bars represents control conditions (rats non‐exposed to LED), and black bars represent rats exposed to LED.