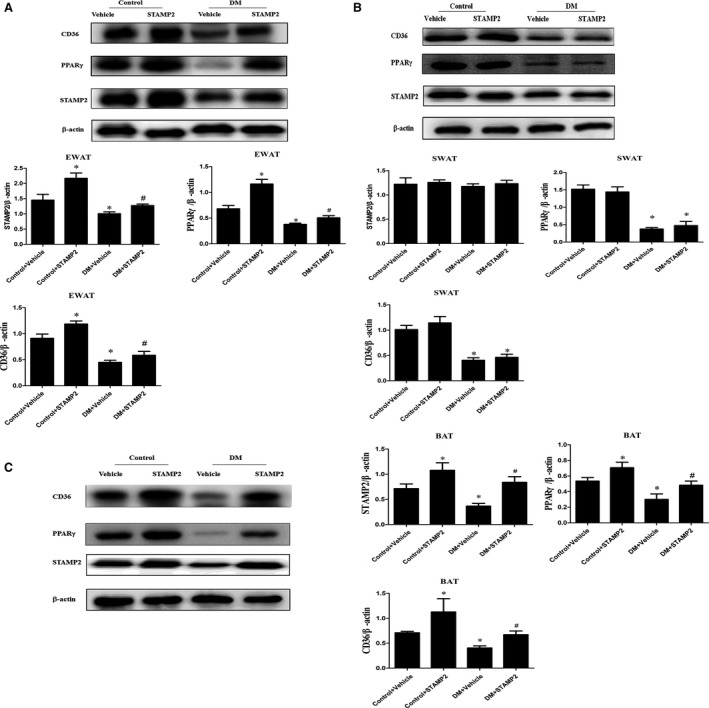
Figure 3.

Western blot analyses of STAMP2, PPARγ and CD36 in WAT and BAT from ApoE−/−/LDLR −/− mice adipose tissues (n = 3 mice per group). The Western blots are representative of three separate experiments that gave similar results. (A) Representative Western blot of EWAT; (B) Representative Western blot of SWAT; (C) Representative Western blot of BAT. Data are mean ± SD; *P < 0.05 versus control + vehicle; # P < 0.05 versus DM + vehicle. EWAT, epididymal white adipose tissue; SWAT, subcutaneous white adipose tissue; BAT, brown adipose tissue.
