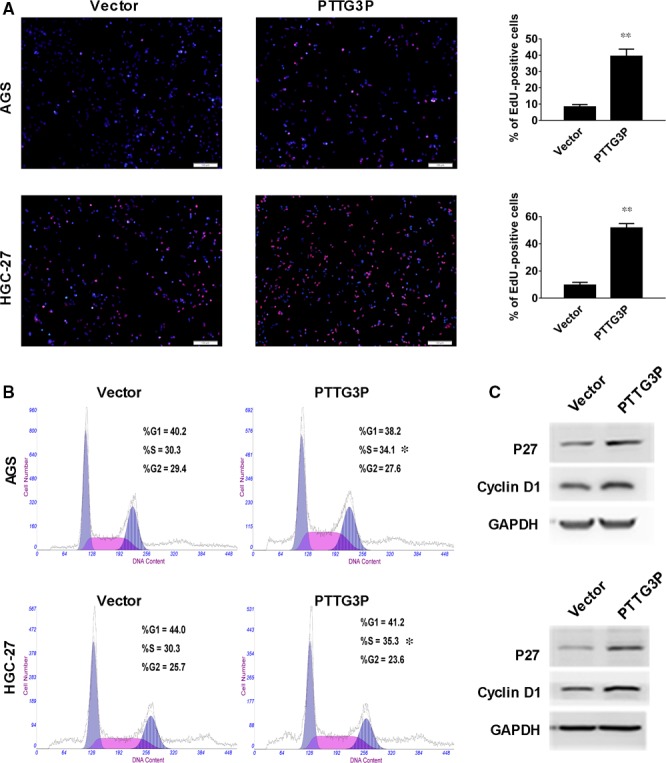
Figure 3.

PTTG3P promotes G1‐S cell cycle transition in GC cells. (A) EdU incorporation was evaluated using an EdU imaging kit. Quantitative analysis showed a greater number of EdU‐positive cells in the PTTG3P‐overexpression group compared to the control. Cells were counted by immunofluorescence microscopy under 200× magnification (scale bars = 100 μm). (B) Cell cycle distribution of AGS and HGC‐27 cells transfected with PTTG3P or a vector control was evaluated using a flow cytometer. (C) Western blotting analysis of the expression levels of cyclin D1 and p27. GAPDH was used as a reference. Data are shown as the mean ± SD of three replicates; **P < 0.01.
