Figure 6.

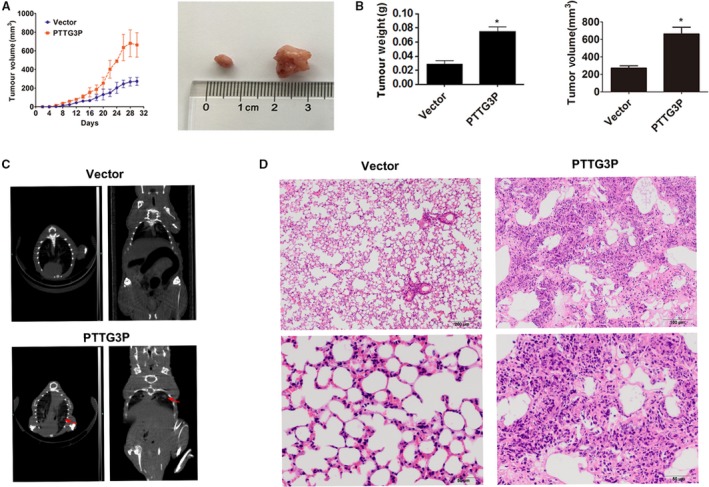
PTTG3P promotes GC tumour growth and metastasis in vivo. (A) Tumour volumes of xenograft models were measured every 4 days. Representative photographs of tumour macroscopic appearance are shown. (B) Tumour size and body weight in the PTTG3P‐overexpression xenograft group compared with the control. (C) CT scanning of the metastasis models. Red arrows denote potential pulmonary metastases in PTTG3P‐overexpressing nude mice. (D) H&E staining was used to verify the formation of pulmonary metastatic tumours in the PTTG3P‐overexpression group (top scale bars = 200 μm; bottom scale bars = 50 μm). Data are shown as the mean ± SD of three replicates; *P < 0.05.
