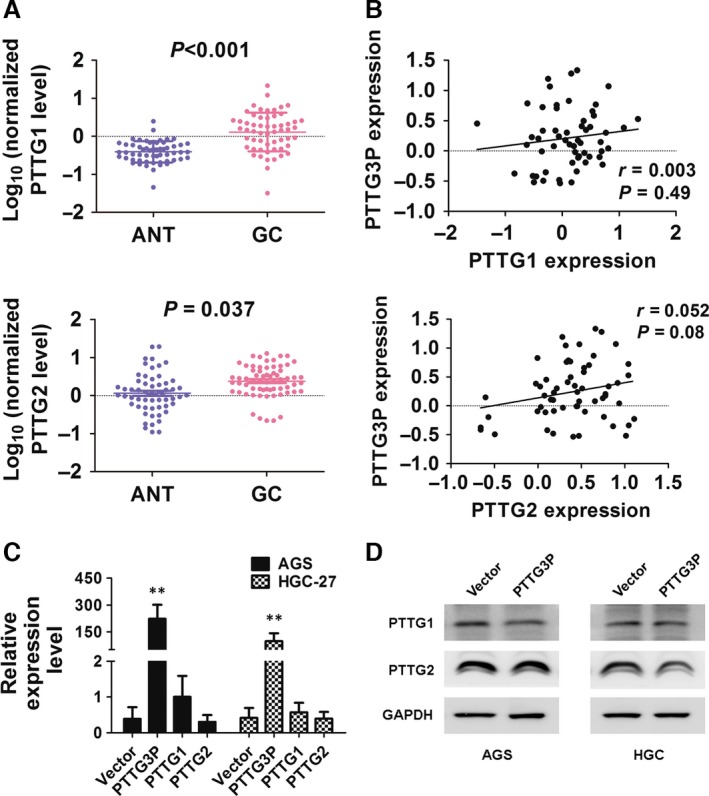
Figure 7.

PTTG3P overexpression is not correlated with PTTG1 or PTTG2 expression. (A) The expression of PTTG1 and PTTG2 in adjacent non‐tumour (ANT) and GC tissues was determined by qRT–PCR. (B) Correlations between PTTG3P expression and PTTG1 or PTTG2 expression were evaluated. (C) mRNA expression levels of PTTG1 and PTTG2 in cells overexpressing PTTG3P were evaluated by qRT–PCR. (D) Protein expression levels of PTTG1 and PTTG2 in cells overexpressing PTTG3P were evaluated by Western blotting; GAPDH was used as a reference. Data are shown as the mean ± SD of three replicates; **P < 0.01.
