
Figure 1.
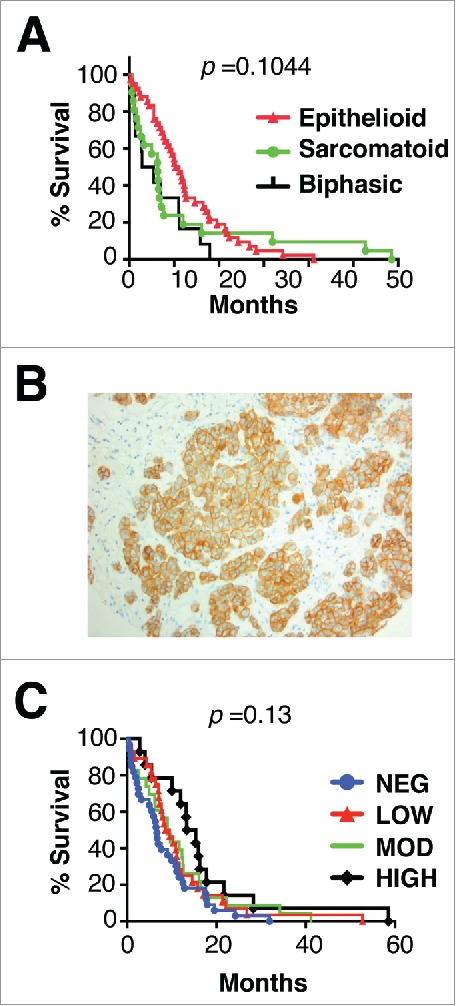
Histology, MET receptor expression and survival analysis of patients with malignant pleural mesothelioma. (A) Kaplan Meier plot for survival of patients with mesothelioma of the specified histologic subtypes. (B) Representative example of MET staining pattern seen in mesothelioma tissue microarray sections. Magnification × 200. (C) Kaplan Meier plots for survival of patients with mesothelioma according to level of expression of MET. p value was generated by Log-rank (Mantel Cox) test.