
Fig. 3.
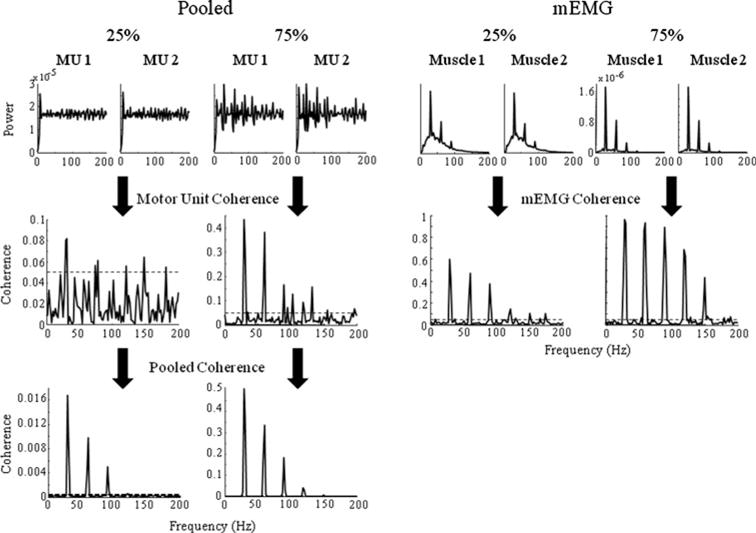
Examples of single MU and unrectified mEMG autospectra (top row, left and right panels, respectively), MU and mEMG coherence (middle row) and pooled coherence (bottom row) for common input strengths of 25 and 75% (left and right panels, respectively). Horizontal lines denote 95% confidence limits (limits for pooled coherence are 1.75e × 10−4). Note the different scales for the y-axes