
Fig. 5.
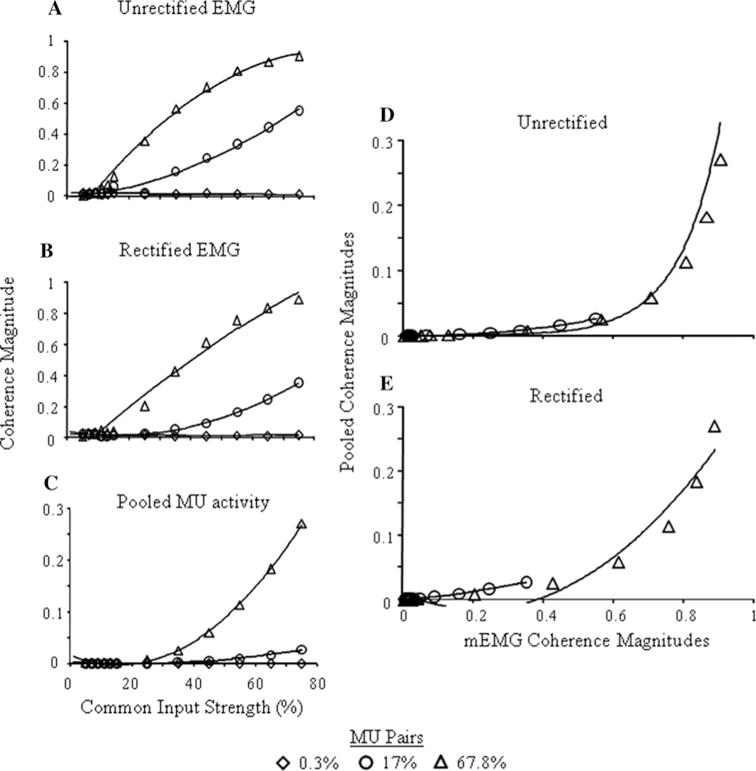
Average coherence magnitudes at the common input frequency are shown for a unrectified mEMG, b rectified mEMG and c pooled MU activity. Relations between pooled and d unrectified and e rectified mEMG are also shown. Coherence magnitudes are shown for all common input strengths and for 0.3, 17 and 67.8% correlated MU pairs. Lines indicate best fit functions. Note the different scales for the y-axes