
Fig. 2. Staphylococcal species increase during AD disease flare.
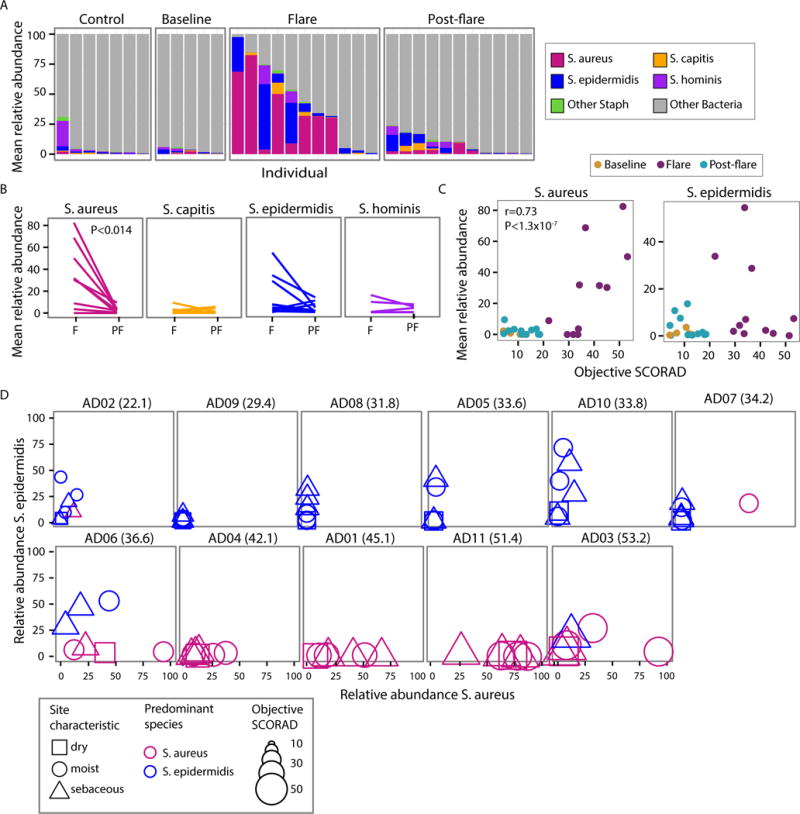
(A) Mean relative abundance of staphylococcal species within the total bacterial population in combined antecubital (Ac) and popliteal creases (Pc) (AcPc) of AD patients and controls. (B) Mean relative abundance of most abundant Staphylococcus species in AcPc for disease states, Flare (F) and Post-flare (Pf). (C) Correlation of S. aureus (left) and S. epidermidis (right) mean relative abundance and objective SCORAD for AcPc of patients, partial correlation (adjusting for disease state). (D) Comparison of S. aureus to S. epidermidis relative abundance by patient for all sites. Patient’s objective SCORAD indicated in parenthesis. Shape corresponds to physiological characteristic of the body site, color to the predominant species, and size to the magnitude of disease severity (objective SCORAD). Patients in the top row have a higher predominance of S. epidermidis, while bottom row patients are S. aureus-predominant.