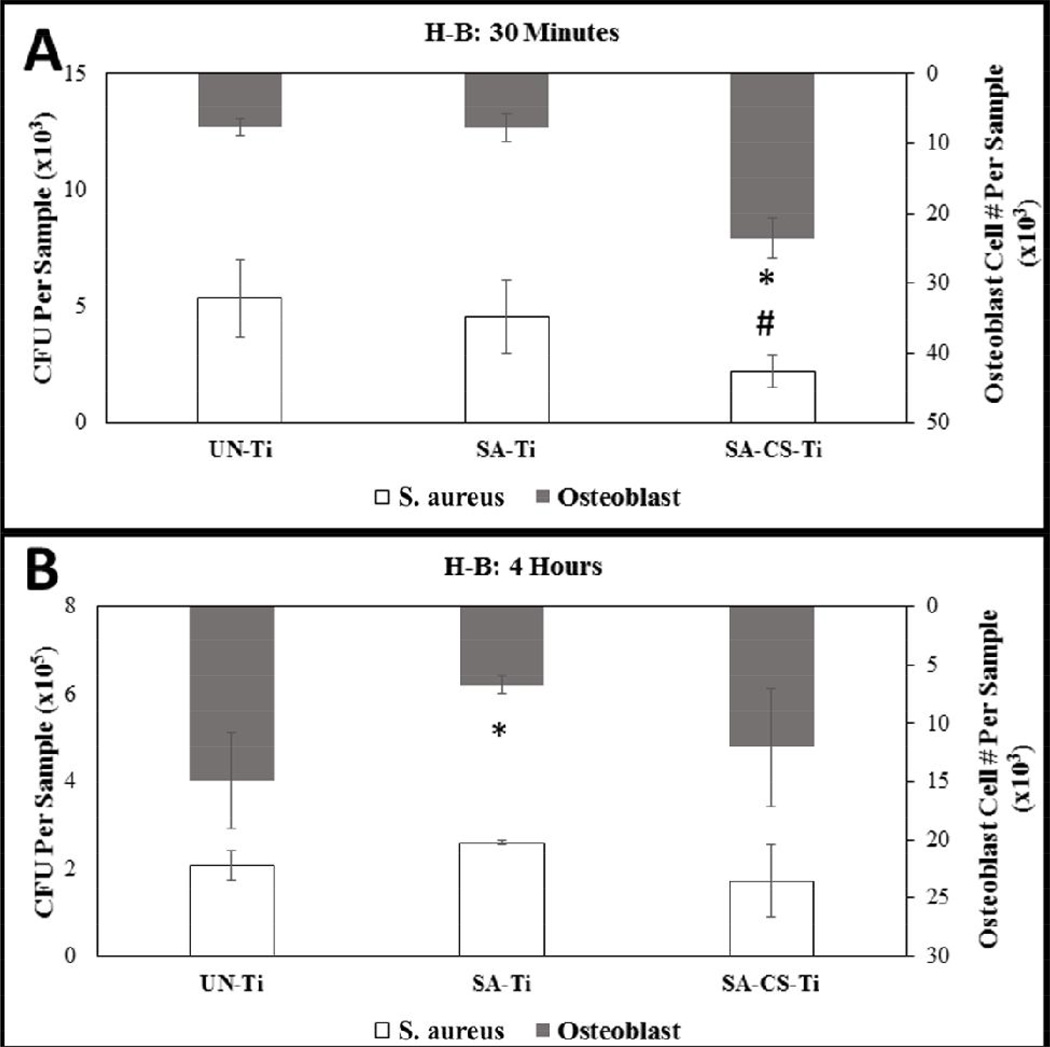
Figure 2.
H-B Co-culture graphs showing quantitation of osteoblast and bacteria at 30 minute (A) and 4 hour time (B) points. The SA-CS-Ti had decreased the number of osteoblast attached, yet had the lowest number of bacteria attachment over 30 minute and 4 hour time points. Statistical significance from the UN-Ti group is denoted by * and # (p<0.05).

