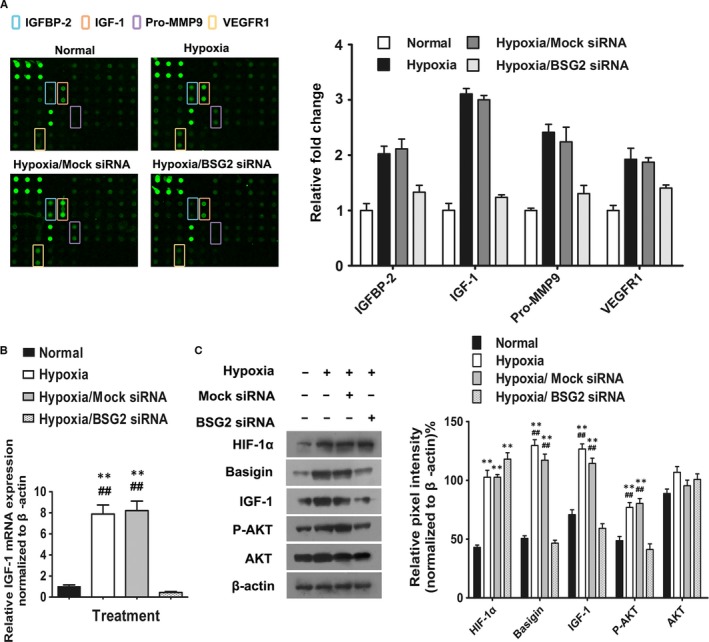
Figure 4.

Microglia‐induced endothelial angiogenesis is attributed to Microglia‐derived soluble factors. (A) Expression levels of angiogenesis‐related proteins from BV2 in four groups: normal, hypoxia, hypoxia treated with Mock siRNA and hypoxia treated with basigin‐2 siRNA (BSG2 siRNA). Left panel are scanned images of four groups of angiogenesis array data. The first six dots located in upper left corners of the arrays are positive controls and the next four spots are negative controls respectively. Array spots were taken and analysed by Image J software. Expression levels were presented as a mean pixel density normalized by the positive spot references. Right panel showed histogram profile of the relative fold change of four a giogenesis proteins identified from the array study after different treatment. The results were generated by quantifying the mean spot pixel density from the arrays using Image J software. (B) Quantitative real‐time PCR was specifically performed for IGF‐1 after BSG2 siRNA treatment. ** P < 0.05 versus normal group; ## P < 0.05 versus hypoxia BSG2 siRNA group. (C) Representative Western blot analysis of HIF‐1α, basigin, IGF‐1, AKT and phosphorylated AKT in BV2 cell.
