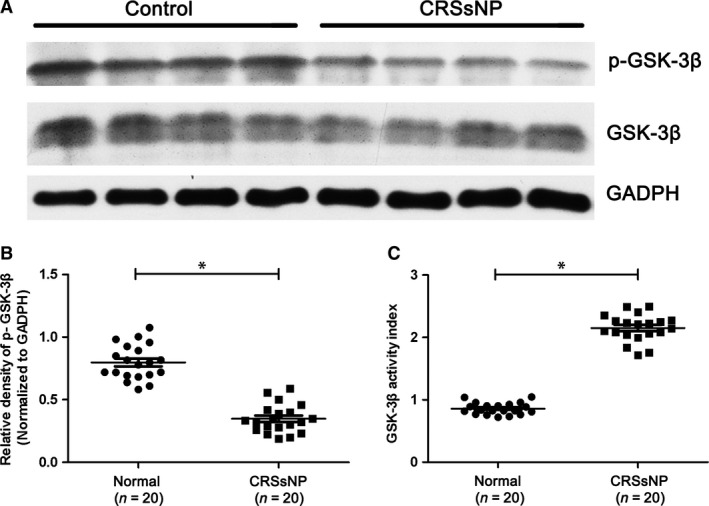
Figure 4.

The protein level of phsophorylated GSK‐3β in CRSsNP and normal control. (A) Representative Western blot results of p‐GSK‐3b (s9) and GSK‐3b in CRSsNP and normal control. (B) Relative level of p‐GSK‐3b in CRSsNP and normal control. (C) GSK‐3b activity index in CRSsNP and normal control. * P< 0.05.
