
Figure 7.
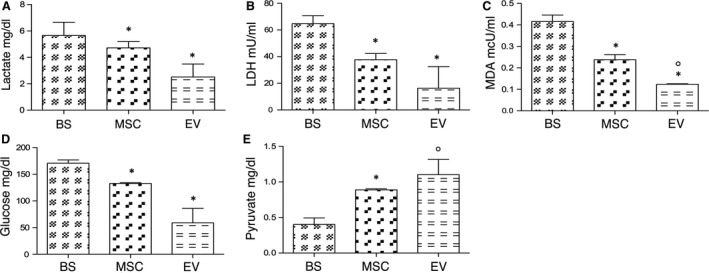
Markers of ischaemic damage and energy substrates in effluent fluid. Columns show levels of lactate (mg/dl), LDH (mU/ml), malondialdehyde (MDA) (mcU/ml), glucose (mg/dl) and pyruvate (mg/dl) in effluent fluid from each group. Data are means ± S.D. The groups are defined in Figure 4. Panel A. *P < 0.05 versus BS. Panel B. *P < 0.05 versus BS. Panel C. *P < 0.05 versus BS; °P < 0.01 versus MSC. Panel D. *P < 0.05 versus BS. Panel E *P < 0.05 versus BS; °P < 0.005 versus BS.