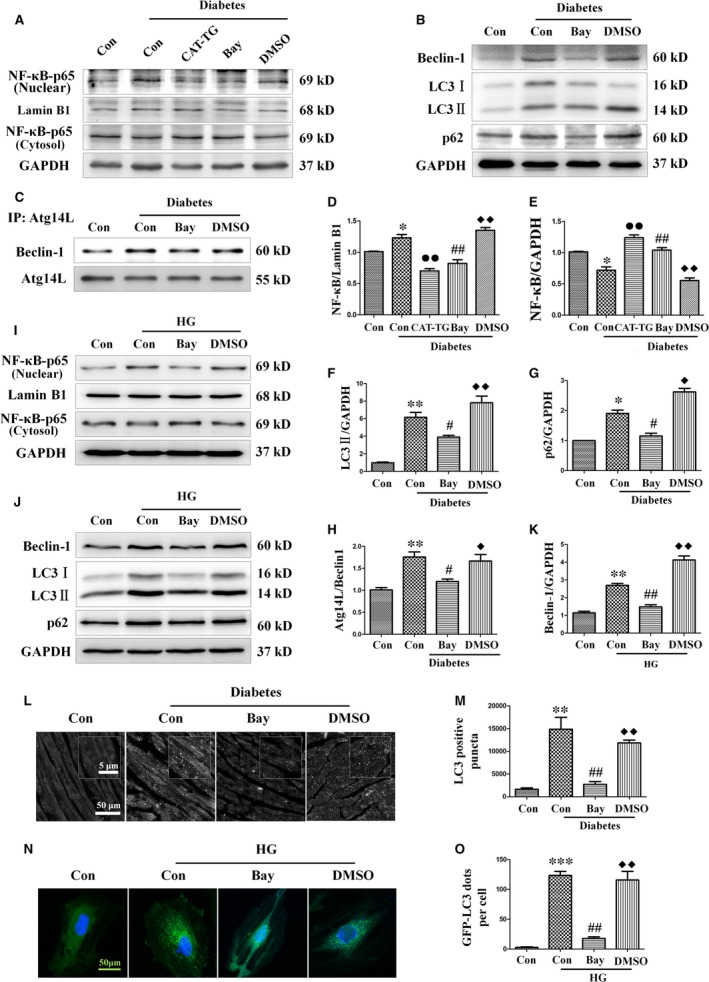
Figure 6.

Catalase inhibits nuclear translocation of NF‐κB and treatment with the NF‐κB inhibitor Bay11‐7082 ameliorates diabetes‐induced autophagy. WT mice were injected intraperitoneally with sodium citrate buffer (control group), a single dose of STZ (diabetes control group), a single dose of STZ followed by treatment with Bay11‐7082 (diabetes + Bay11‐7082 group) or a single dose of STZ followed by administration of DMSO (vehicle) (diabetes + DMSO group), and CAT‐TG mice were injected intraperitoneally with a single dose of STZ (CAT‐TG diabetes group). Nuclear and cytosolic protein extracts were prepared, and the expression of NF‐κB was assessed by Western blot analysis (A) and semi‐quantitatively analysed, with lamin B1 (D) and GAPDH (E) being used as loading controls for nuclear and cytosolic protein, respectively. Expression of beclin‐1, LC3‐II and p62 was assessed by Western blot analysis with GAPDH as a loading control (B). The band densities of LC3‐II (F) and p62 (G) were semi‐quantitatively analysed. The binding of Atg14L to beclin‐1 was assessed by co‐immunoprecipitation (C) and semi‐quantitatively analysed (H). H9c2 myocardial cells were pre‐treated with Bay11‐7082 or vehicle (DMSO) for 10 min. and then incubated in a high‐glucose concentration (33 mM) for 24 hrs. p65 (nuclear and cytosolic fractions) (I), beclin‐1, LC3‐II and p62 (J) were assessed using Western blot. The band density of beclin‐1 (K) was semi‐quantitatively analysed. Mice hearts (L) and GFP‐LC3 adenovirus transfected cells (N) were used to semi‐quantitatively evaluate autophagy by the detection of LC3 immunofluorescence dots (M and O, respectively). LC3 fluorography magnification: ×60; bars = 50 μm. Values are mean ± S.E.M. Each group included six mice. In vivo results, *P<0.05, **P<0.01 and ***P<0.001 versus WT Control; #P<0.05, ##P<0.01 versus WT Diabetes; ◆P<0.05, ◆◆P<0.01 versus WT Diabetes+Bay11‐7082; ●P<0.05, ●●P<0.01 versus WT Diabetes. In vitro results, **P<0.01 and ***P<0.001 versus Control; ##P<0.01 versus High glucose; ◆◆P<0.01 versus High glucose +Bay11‐7082.
